
Spectrum Analyzer
Spectrum Analyzer :
Introduction:-
A spectrum analyzer provides a calibrated graphical display on its CRT, with frequency on the horizontal axis and amplitude (voltage) on the vertical axis.

(The most common way of observing signals is to display them on an oscilloscope with time as the
X-axis (i.e.between amplitude of the signal and time). This is the time domain. It is also useful to display signals in the frequency domain. The providing this frequency domain view is the spectrum analyzer.)
Displayed as vertical lines against these coordinates are sinusoidal components of which the
input signal is composed. The height represents the absolute magnitude, and the horizontal
location represents the frequency.
These instruments provide a display of the frequency spectrum a given frequency band.
Spectrum analyzers use either parallel filter bank or a swept frequency technique.
In a parallel filter in a parallel filter bank analyzer, The frequency range is covered by a series of
filters whose central frequencies and bandwidth are so selected that they overlap each others, as
shown in fig 4.1.


Typically, an audio analyzer has 32 of these filters, each covering one third of an octave.
For wide band narrow resolution analysis, particularly at RF or microwave signals, the swept
Technique is preferred.

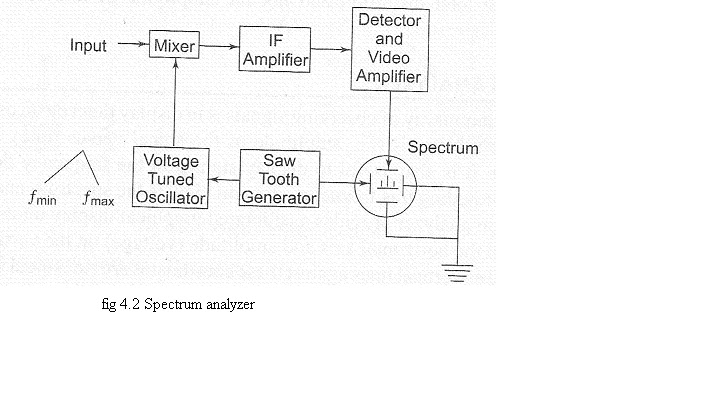
as per reference to the block diagram of fig. 4.2, the saw tooth generator provides the saw tooth voltage ,which drives the horizontal axis element of the scope and this saw tooth voltage is the frequency
signal and produce an IF, whenever a frequency component is met during its sweep.
The frequency component and voltage tuned oscillator frequency beats together to produce a
difference frequency, i.e. The IF corresponding to the component is amplified and detected if
necessary and then applied to the vertical plates of the CRO, producing a display between of amplitude
The spectrum produced if the input wave is a single toned A.M .
One of the principal applications of spectrum analyzers has been in the study of the RF spectrum
produced in microwave instruments. In a microwave instrument, the horizontal axis can display
as a wide a range as 2 - 3 GHz for a broad survey and as narrow as 30 kHz, for a highly
magnified view of any small portion of the spectrum. Signals at microwave frequency separated
by only a few KHz can be seen individually.
The frequency range covered by this instrument is from I MHz to 40 GHz, The basic block
diagram is of a spectrum analyzer covering the range 500 kHz to 1 GHz, which is
representative of a super heterodyne type
The input signal is fed into a mixer which is driven by a local oscillator. This oscillator is
linearly tunable electrically over the range 2 - 3 GHz.
The mixer provides two signals at its
The mixer provides two signals at its
The IF amplifier is tuned to a narrow band around 2 GH4 since the local oscillator is tuned over
the range of 2 - 3 GHz, only inputs that are separated from the local oscillator frequency by
2GHz will be converted to IF frequency band, pass through the IF frequency amplifier, get
rectified and produce a vertical deflection on the CRT.
From this, it is observed that as the saw tooth signal sweeps, the local oscillator also sweeps
linearly from 2 - 3 GHz. The tuning of the spectrum analyzer is a swept receiver, which sweeps
linearly from 0 to 1 GHz. The saw tooth scanning signal is also applied to the horizontal plates of
the CRT to form the frequency axis. (The spectrum analyzer is also sensitive to signals from 4 -
5 GHz referred to as the image frequency of the super heterodyne. A low pass filter with a cutoff
frequency above I GHz at the input suppresses these spurious signals.)
The two types of spectrum analyzers are,
1. Fliter Bank Spectrum analyzer.
2. Super hetero dyne Spectrum analyzer.
1. Filter Bank Spectrum analyzer

2. Super hetero dyne Spectrum analyzer
The modern spectrum analyzers use a narrow band super heterodyne receiver. Super heterodyne
The functional block diagram of super heterodyne spectrum analyzer or RF spectrum analyzer as shown in the
The functional block diagram of super heterodyne spectrum analyzer or RF spectrum analyzer as shown in the
Figure 7.2

The RF input to be analyzed is applied to the input attenuator. After attenuating, the signal is fed
to low pass filter.
The low pass filter suppresses high frequency components and allows low frequency components
to pass through it. The output of the low pass filter is given to the mixer, where this signal is
fixed with the signal coming from voltage controlled or voltage tuned oscillator.
This oscillator
This oscillator
tuned over 2 to 3 GHz, the IF amplifier is tuned to a narrow band of frequencies of about 2 GHz.
Therefore only those signals which are separated from the oscillator frequency by 2 GHz are
converted to Intermediate Frequency (IF) band. This IF signal is amplified by IF amplifier and
then rectified by the detector. After completing amplification and rectification the signal is
applied to vertical plates of CRO to produce a vertical deflection on the CRT screen. Thus, when
the saw tooth signal sweeps, the oscillator also sweeps linearly from minimum to maximum
frequency range i.e., from 2 to 3 GHz. Here the saw tooth signal is applied not only to the
oscillator (to tune the oscillator) but also to the horizontal plates of the CRO to get the frequency
axis or horizontal deflection on the CRT screen. On the CRT screen the vertical axis is calibrated
in amplitude and the horizontal axis is calibrated in frequency.
Application:
These Spectrum analyzers are widely used in the field of,
1. Bio medicals
2. RADARS
3.Oceangraphy


Post a Comment